Figure 2.
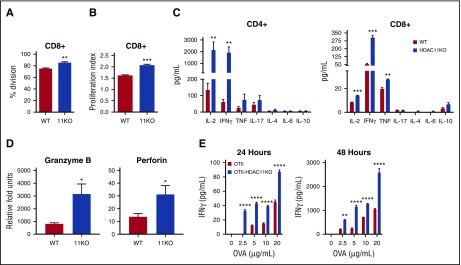
HDAC11KO T cells have increased effector functions. (A) CD8+ T cells from HDAC11KO mice were stained with a proliferation tracking dye and activated for 72 hours with αCD3/CD28 stimulation. Proliferation was evaluated by flow cytometry. The percentage of cells (± standard error of the mean [SEM]) undergoing 1 or more divisions was graphed. Data shown are from 3 mice per group and representative of 3 independent experiments. (B) The proliferative index of these cells (ie, total number of divisions divided by the number of cells that went into division) was also determined. (C) CD4+ and CD8+ T cells from HDAC11KO mice were activated by CD3/CD28 stimulation for 72 hours. Supernatants were assessed by cytokine bead array for indicated cytokines. Values shown are from 3 mice per group (± SEM) and representative of 3 independent experiments. (D) CD8+ T cells from WT and HDAC11KO mice were left unstimulated or activated for 6 hours by αCD3/CD28–conjugated beads. Samples were then assessed by qRT-PCR for expression of granzyme B and perforin mRNA. Values shown are from 3 mice per group (± SEM) and representative of 3 independent experiments. (E) OVA-antigen–specific CD4+ T cells from OTII or OTII/HDAC11KO mice were cultured with splenocytes harvested from WT mice and pulsed with indicated concentrations of OVA peptide. Twenty-four and 48 hours later, IFN-γ production was assessed by ELISA. Results shown are from 3 mice per group and representative of 3 independent experiments. *P < .05; **P < .01; ***P < .001; ****P < .0001.

