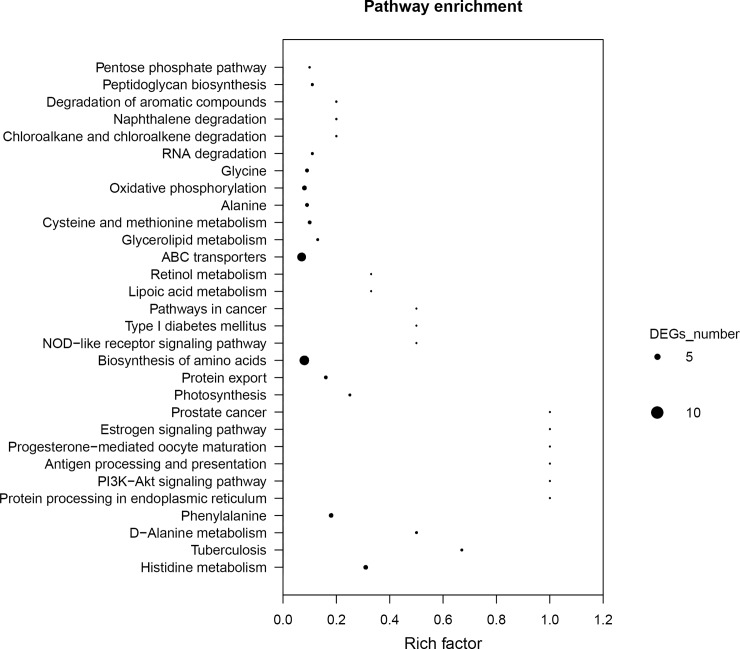
Fig 6. Scatter plot of enriched pathways from KEGG annotation of differential expression genes (DEGs) in resistant versus susceptible strains of A. hydrophila.
Scatter plot of the degree of differences in the expression profile of E. sinensis. X-axis, Rich factor; Y-axis, pathway name. A corrected p-value < 0.05 was defined as ‘threshold’. KEGG pathway were considered significantly enriched in the DEGs. The size of the dots to indicate the number of DEGs contained in each pathway.

