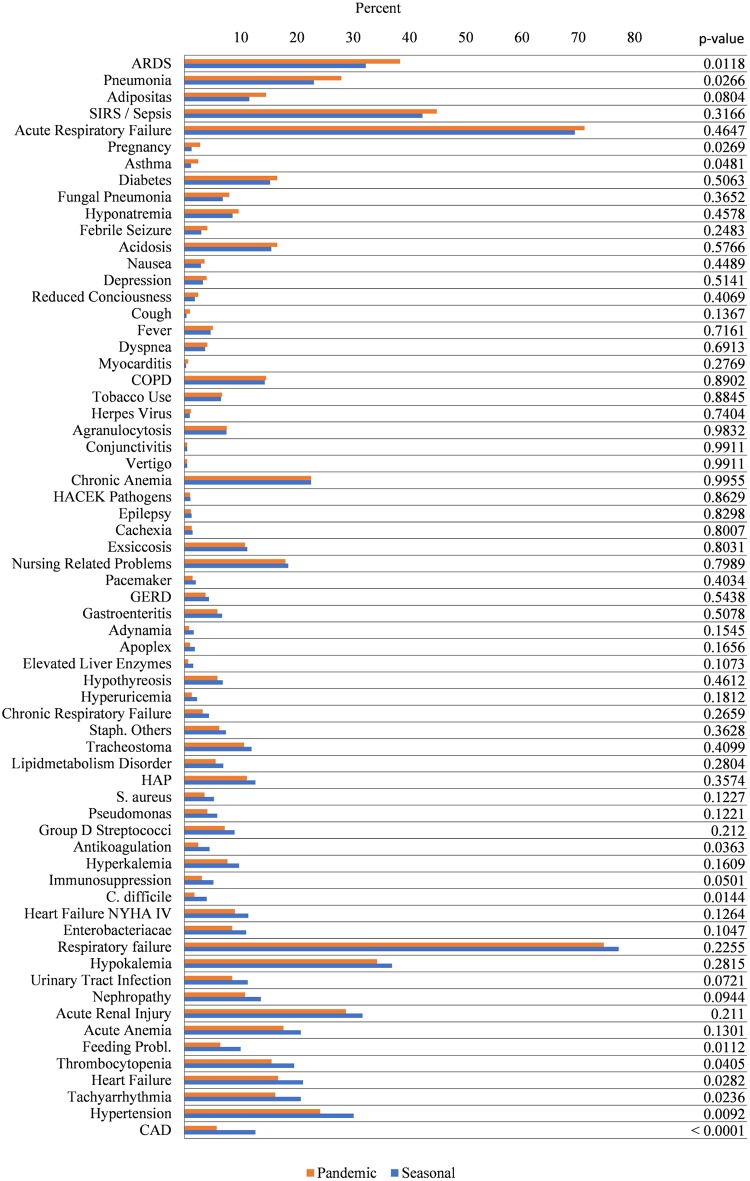
Fig 6. Relative frequencies of comorbidities and co-diagnoses in patients receiving mv in pandemic and seasonal influenza.
Relative frequencies are given as a percentage of all hospitalized patients receiving MV. Comorbidities are ordered by the magnitude of the absolute difference in relative frequencies between pandemic (red) and seasonal influenza (blue). Comorbidities that number less than three are censored in compliance with the DeStatis data protection policy.

