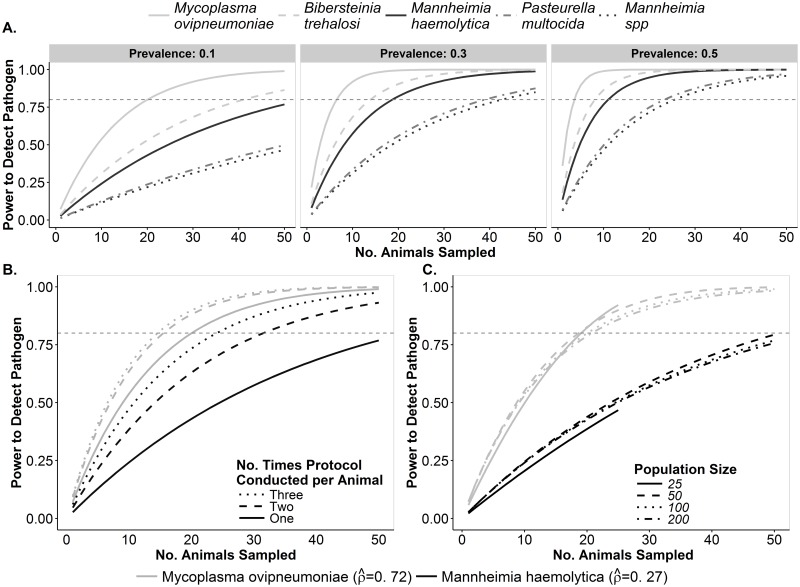
Fig 3. Power to detect five respiratory pathogens in bighorn sheep populations using the TSB protocols.
Variability in power to detect pathogens at the population level is shown as it relates to different pathogens, population size, pathogen prevalence, number of animals sampled, and number of times protocols are conducted per animal. For all panels, each curve illustrates the power to detect each pathogen (y-axis) given the number of animals sampled from a population (x-axis). The horizontal dashed-gray line across each panel represents adequate (i.e., 80%) detection power. A. Variability in the power to detect each pathogen when the TSB protocol is conducted once per animal at three levels of pathogen prevalence in a population of 100. B. Effects of conducting TSB protocol multiple times per animal on power to detect two pathogens with either relatively high or relatively low detection probability in a population of 100 animals with 10% pathogen prevalence. C. Effect of population size on power to detect two pathogens with either relatively high or relatively low detection probability in a population of 100 animals with 10% pathogen prevalence.

