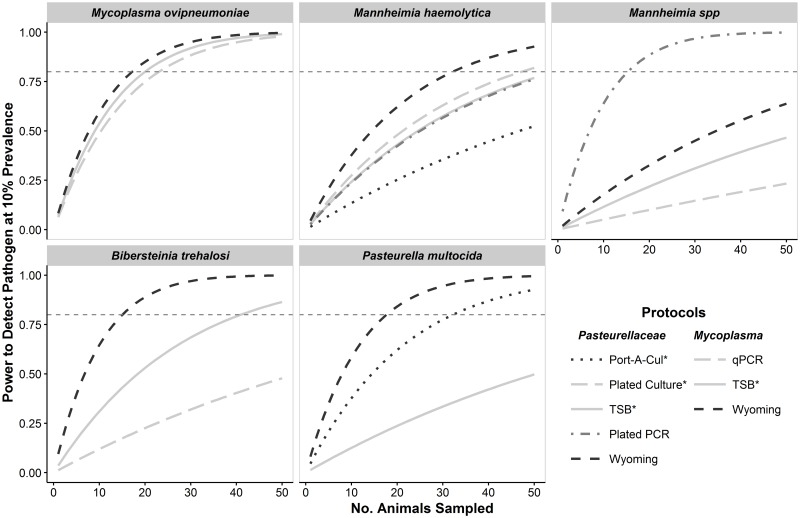
Fig 4. Power to detect five respiratory pathogens in bighorn sheep populations using different diagnostic protocols.
For all panels, each curve illustrates the power to detect each pathogen at the population-level (y-axis) given the number of animals sampled from a population (x-axis) when the specified protocol was conducted once per animal. Within each panel, protocols where detection probability was estimated at zero or one are not displayed. The horizontal dashed-gray line across each panel represents adequate (i.e., 80%) detection power.

