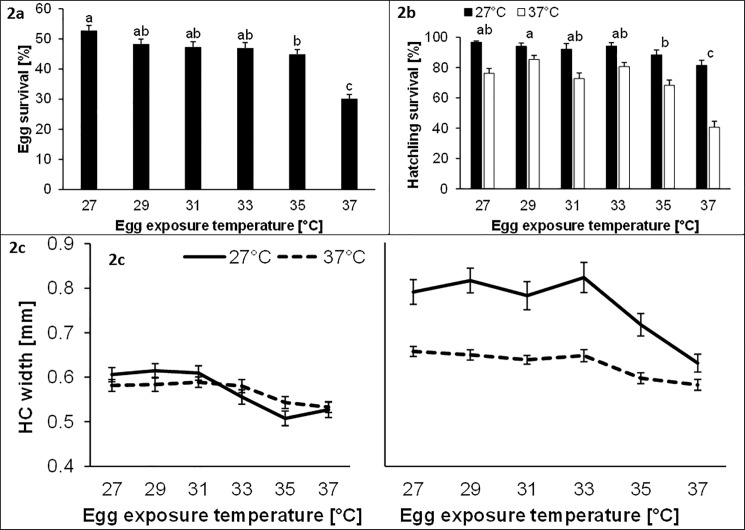
Fig 2.
Egg survival rates in relation to temperature (a; 24 h at 27, 29, 31, 33, 35 or 37°C), hatchling survival rates in relation to egg temperature and heat stress (b; exposure of hatchlings for 24 h to 27°C or 37°C), and head capsule (HC) width in relation to egg temperature and heat stress for dead and alive individuals (c) in Bicyclus anynana. Given are means ± 1 SE. Sample sizes range between 132 and 199 groups (a), 23 and 55 groups (b), and 6 and 55 groups (c) with 10 individuals each. Different lower case letters above bars indicate significant differences among egg temperatures (Tukey’s HSD for unequal sample size).

