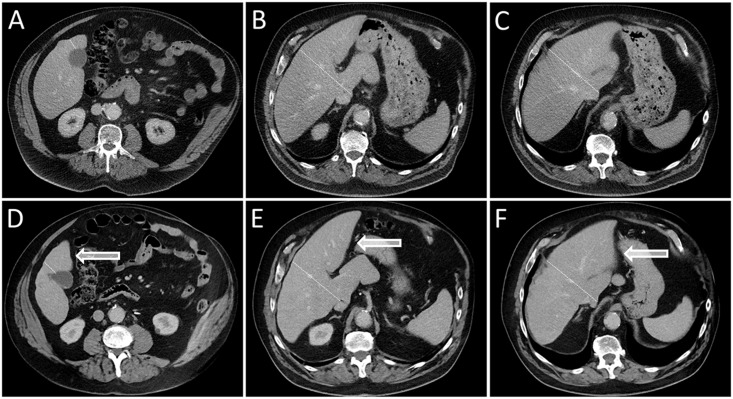
Fig 2. Example of left lobar hypertrophy after right-sided RE.
Liver computed tomography images acquired in three different levels before RE (A-C) and 6 months after right-sided RE (D-F) show left lobar hypertrophy (highlighted by arrows) and right lobar atrophy in a 65-year-old man suffering from HCC and non-alcoholic steatohepatitis. (The liver lobe border is marked by a dotted line.).

