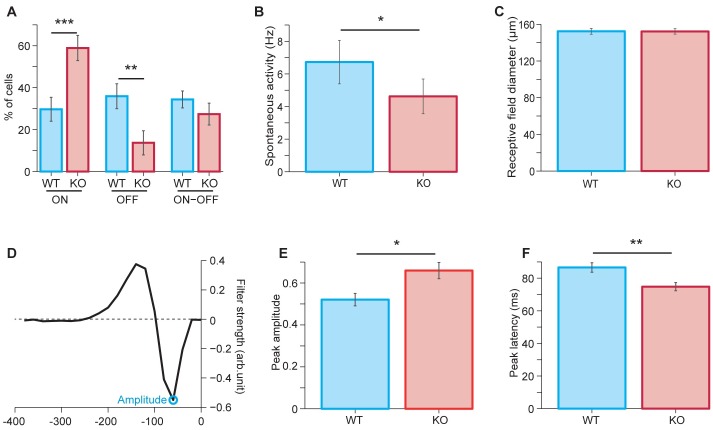
Fig 6. MEA recordings of RGC activity in WT and NL3-KO retina.
The responses of RGCs to light stimulation were recorded on MEAs. The proportions of ON and OFF cells were respectively higher and lower in NL3 KO than in WT littermate retinae (A). Overall, NL3 KO RGCs had a lower spontaneous activity rate compared to WT RGCs (B); whereas their receptive field diameter was unchanged (C). Upon white-noise stimulation (D-F), filters from white-noise stimulation (example in D for a WT cell) had significantly larger peak amplitudes (E) and shorter peak latency (F) in NL3 KO retina compared to WT. Data from N = 3 WT- KO littermate pairs; WT = 64 cells (19 ON, 23 OFF and 22 ON-OFF); KO = 73 cells (43 ON, 10 OFF and 20 ON-OFF). Plots represent mean ± SEM. Data in (B-F) are pooled over all three response types.

