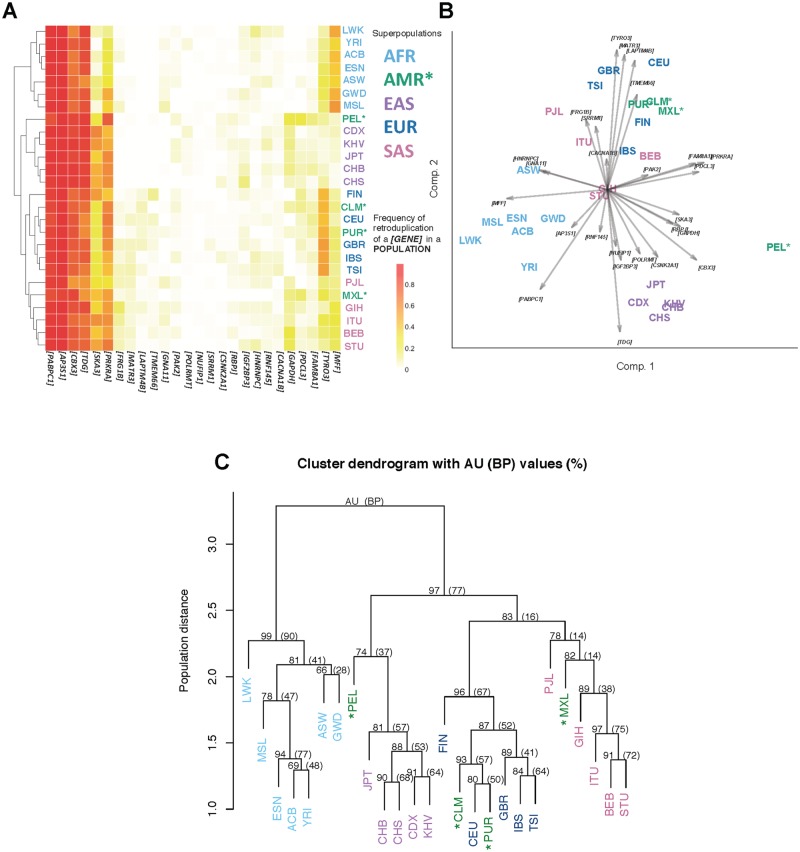
Fig 2. Common retroduplication frequency spectrum and phylogenetic tree.
A—Frequency spectrum of 29 retroduplication events that are detected in more than 10 populations. Hierarchical clustering. B—PCA biplot of the populations based on frequencies of these 29 retroduplication events. Different colors indicate five superpopulations, i.e. AFR (African), AMR (Ad Mixed American), EAS (East Asian), EUR (European), and SAS (South Asian). Arrows represent loadings of parent genes. Ad Mixed Americans are marked with ‘*’. C—Consensus phylogenetic tree built based on novel retroduplications from all 26 populations enrolled in the 1000 Genome Project Phase 3. Bootstrap probability (BP) value is computed from ordinary bootstrap resampling. It is the frequency of the cluster appearing in bootstrap replicates. Approximately unbiased (AU) probability value is calculated from multiscale bootstrap resampling [33,34]. AU is less biased than BP. Bootstrap resampling was performed 1,000 times for generating the trees that are summarized in the consensus tree. Manhattan distance and average linkage was used in hierarchical clustering.

