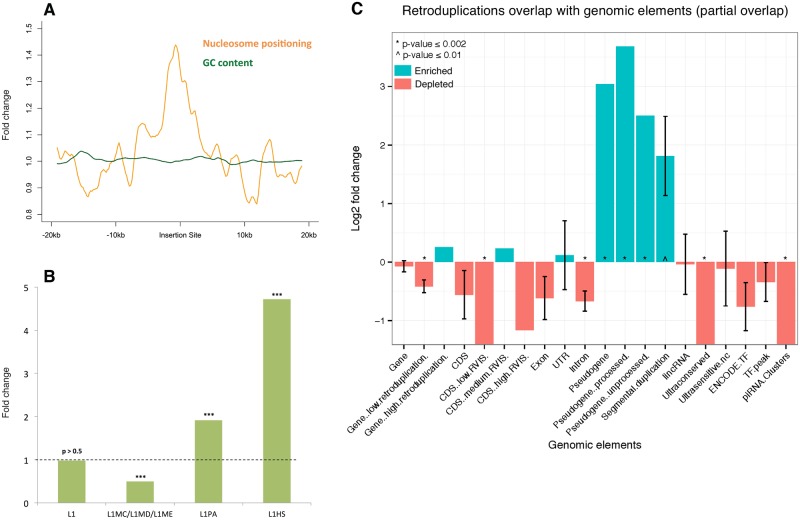
Fig 3. Overlap between retroduplication insertion sites and genomic features/functional elements.
A—Aggregation plot around insertion sites with strongly positioned nucleosomes. B—Association between discordant read clusters that only have support on one side and L1 element subfamilies. Fold change and empirical p-values were obtained from permutations tests. *** indicates adjusted p-value < 0.001. C—Overlap between genomic elements and retroduplication insertion sites. The enrichment of overlap is expressed as log2 fold change of the observed overlap statistic versus the mean of its null distribution. Positive (negative) log2 fold change indicates enriched (depleted) genomic element-insertion overlap, compared to random background. * indicates empirical p-value ≤ 0.002.

