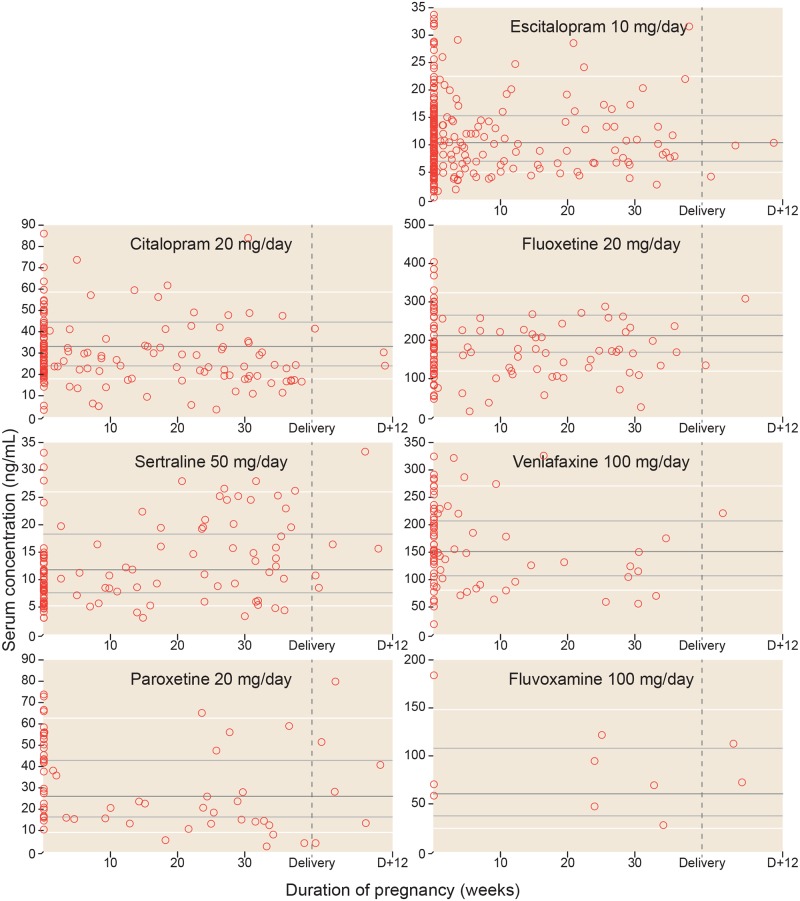
Fig 2. The serum antidepressant concentrations across pregnancy.
The figure shows each of the observed serum concentrations in the study, adjusted to the doses presented in Table 2. Observations from the same women in non-pregnant state (baseline values) are shown as pregnancy week 0. Delivery is set to pregnancy week 40. Thus, for a woman who gave birth in week 38, a sample drawn x weeks after delivery would be shown x weeks to the right of the vertical delivery line. For fluoxetine and venlafaxine the concentrations shown represent the active moiety (parent drug + metabolite). Three outliers for escitalopram are not shown in the figure. These are one analysis in week 0 (concentration 36 ng/mL), one analysis in week 4 (concentration 36 ng/mL) and one analysis in week 5 (concentration 40 ng/mL). However, these concentrations are included in the statistical analyses. The horizontal lines represent the median (dark grey), 25 and 75 percentiles (light grey) and 10 and 90 percentiles (white) for dose-adjusted serum concentration measurements for all women aged 18–45 years from the St. Olav University Hospital TDM database. For further details, see Methods section.

