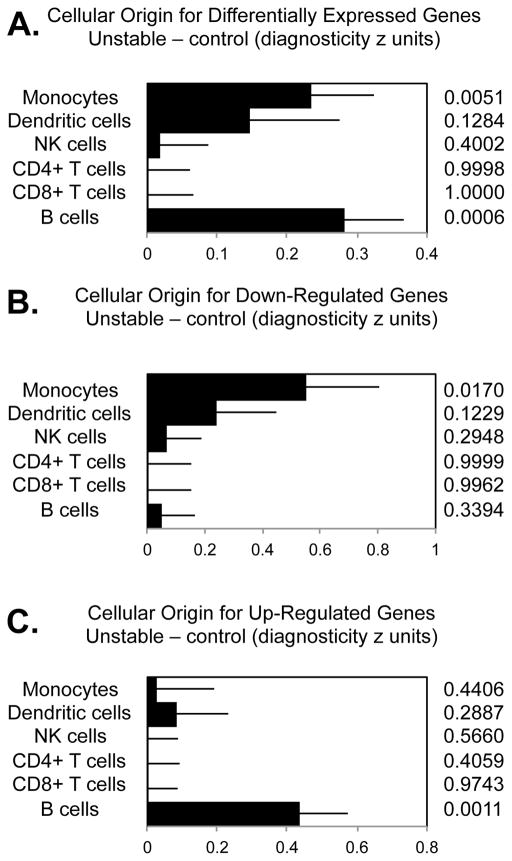
Figure 2.
Transcript origin analysis identifying major leukocyte subset origins of (A) all differentially expressed 194 gene transcripts; (B) 82 down-regulated transcripts; (C) 112 up-regulated transcripts that showed ≥ 1.25 fold differential expression in unstable vs. stable social conditions. P values were derived by comparing the mean diagnosticity score for each candidate cell type of origin with the null diagnosticity value of 0, with standard errors estimated by bootstrap resampling.

