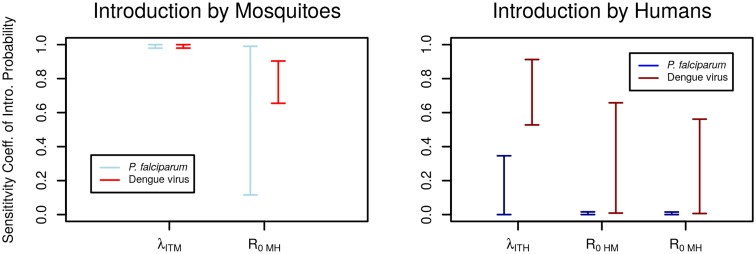
Fig 5. Sensitivity of introduction pathways to each individual step.
Sensitivity coefficients indicate the percent change in the probability of introduction given a 1% change in each individual parameter (S1 Text). The probability of travel and the prevalence of infection are combined in the parameters λITM and λITH.

