
Fig. 2. TA in the near-IR and visible regions reveal singlet and triplet characters of 1(TT).
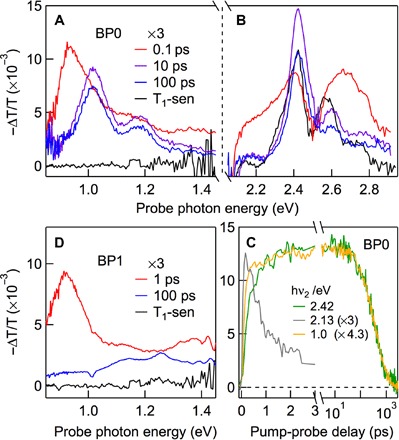
TA spectra in (A) the near-IR and (B) the visible regions for BP0 at different pump-probe delays, Δt = 0.1 ps (red), 10 ps (purple), and 100 ps (blue), following excitation at time zero by hν1 = 2.1 eV. The triplet TA spectrum from sensitization (black) is also shown in (A) and (B). (C) Kinetic profiles from TA spectra for BP0 at the indicated probe photon energies. (D) TA spectra at Δt = 1 ps (red) and 100 ps (blue) for BP1 following excitation at time zero by hν1 = 2.1 eV. The corresponding triplet spectrum (black) from sensitization is also shown.