
Fig. 6. TA reveals the strong coupling of CT state to T1.
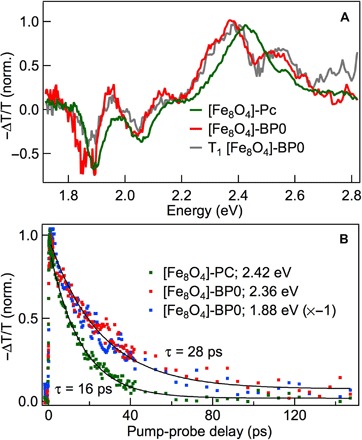
(A) TA spectra at 1 ps for [Fe8O4]-Pc (green) and [Fe8O4]-BP0 (red) upon CT excitation of 1.65 eV. The gray curve is the triplet spectrum of [Fe8O4]-BP0 from triplet sensitization. (B) Triplet decay dynamics for [Fe8O4]-Pc (green) and [Fe8O4]-BP0 (red and blue for ESA and ground-state bleaching, respectively). The solid curves are single-exponential fits with the indicated lifetimes (τ = 16 ± 2 ps for [Fe8O4]-Pc and 28 ± 3 ps for [Fe8O4]-BP0).