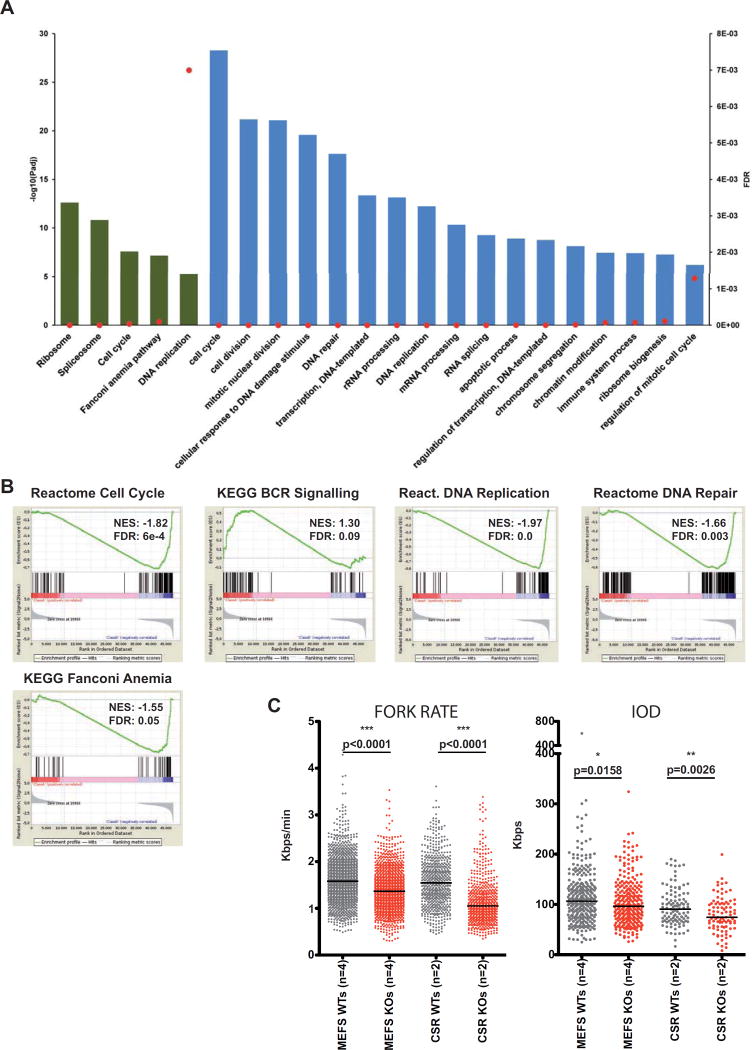
Figure 6.
Severe alteration of biological processes in Whsc1−/− GC B cells (A) Threshold-based functional pathway analysis for the differentially expressed genes in GC B cells (Whsc1−/− vs. WT) with DAVID. Selected KEGG (green) and GO (blue) pathways are represented. Bars represent the antilogarithm of the adjusted P value (left vertical axis). Red dots represent the False Discovery Rate for the corresponding pathways (right vertical axis). (B) Gene Set Enrichment Analysis (GSEA) plots for the indicated genesets, (see their corresponding heatmaps in Figure S5B). The GSEA comparison was performed [WT minus Whsc1−/−], so the genes downregulated in the Whsc1−/− cells appear at the left of the scale on each graph, and those upregulated appear at the right side. Therefore genesets downregulated in Whsc1−/− cells have a positive Normalized Enrichment Score (NES), and genesets upregulated in Whsc1−/−cells have a negative NES. (C) Impaired DNA replication of Whsc1−/− MEFs and CSR-B cells, as determined by DNA fiber analysis. Fork rate (left panel) in Kbps/min, and Inter Origin Distance, (IOD, right panel) in Kpbs were measured for either MEFs (two leftmost columns in every graph) or CSR-stimulated B cells (two right columns) for WT (grey) or Whsc1−/− (red) cells. n= number of different clones (donors). Horizontal bar represents the median for each data column. See also Figures S5 and S6.

