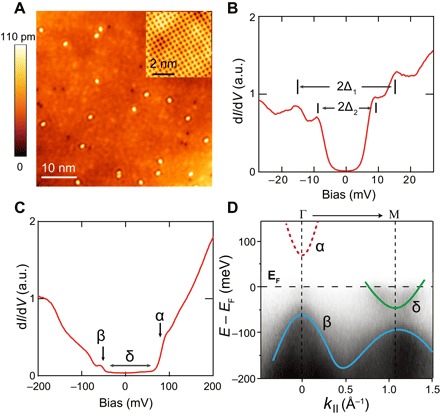
Fig. 1. Topographic image, tunneling, and ARPES spectra of as-cleaved (Li0.8Fe0.2OH)FeSe.

(A) Topographic image of as-cleaved, FeSe-terminated surface (Vb = 100 mV and I = 50 pA); inset shows the surface lattice. (B) Low-energy dI/dV spectrum of as-cleaved FeSe surface, which displays double superconducting gaps of size Δ1 = 15 meV and Δ2 = 9 meV. a.u., arbitrary units. (C) Larger energy scale dI/dV spectrum. Arrows indicate the onset of the α and β bands (see text). Horizontal bar indicates the range of the δ band. (D) ARPES measurement of as-cleaved (Li0.8Fe0.2OH)FeSe. Solid curves track the dispersion of the β and δ bands, whereas the α band above EF is sketched with red dashed curve.
