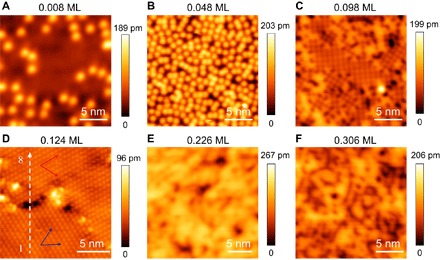
Fig. 2. Topographic images of the FeSe surface with a different Kc.

(A) Kc = 0.008 ML. (B) Kc = 0.048 ML. (C) Kc = 0.098 ML. (D) Kc = 0.124 ML. (E) Kc = 0.226 ML. (F) Kc = 0.306 ML. Typical imaging parameters are Vb = 0.5 V and I = 50 pA. The red and blue arrows in (D) indicate the orientation of two different rotational domains. The white dashed arrow marks the position where the STS in Fig. 5E is taken.
