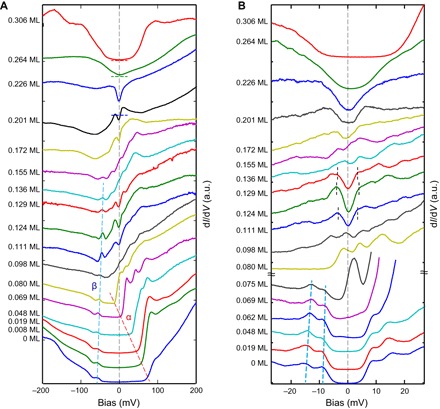
Fig. 3. Evolution of dI/dV spectra taken on the FeSe surface with various Kc as labeled.

(A) Typical dI/dV spectra taken within large energy range (±200 meV). Red and blue dashed lines track the onsets of the α and β bands. The zero positions of the spectra at Kc = 0.306, 0.264, and 0.226 ML are marked by short horizontal bars. (B) Typical dI/dV spectra taken near EF (±27 meV). Two blue dashed lines track the superconducting coherence peaks at negative bias. The curves at Kc ≤ 0.075 ML are normalized by the dI/dV value at Vb = −27 mV, and the curves at Kc > 0.075 ML are normalized by the value at Vb = 27 mV. EF (Vb = 0) is indicated by gray dashed lines. At Kc = 0.111, 0.124, and 0.129 ML, the gap edge positions (defined as Δ3) are marked by short dashed lines.
