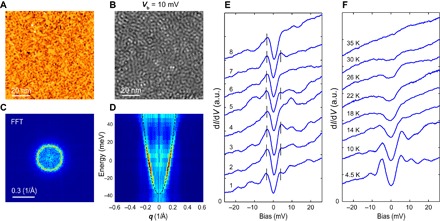
Fig. 5. QPI measurement of the α band and the spatial and temperature dependence of its gap.

(A) Topographic image of the mapping area of size 100 × 100 nm2 (Kc = 0.124 ML). (B) Typical dI/dV map taken at Vb = 10 mV. The set point for dI/dV map is as follows: Vb = 50 mV, I = 150 pA, and ΔV = 3 mV. (C) FFT image of (B). (D) Intensity plot of the FFT linecuts through q = (0, 0); dashed curve is the parabolic fit. Note that the small gap is not observable here because of the large modulation (ΔV). (E) A dI/dV linecut taken along the dashed arrow in Fig. 2D, showing a spatially uniform gap. Bars indicate the coherence peaks. (F) Temperature dependence of the gap taken on a different sample with Kc ~ 0.12 ML.
