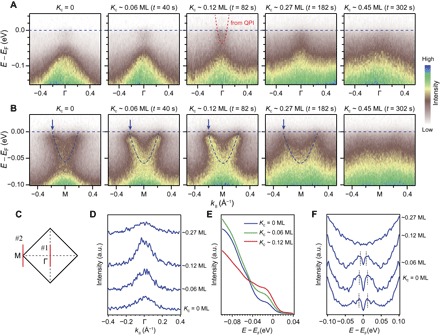
Fig. 6. ARPES measurement of the band structure of surface K–dosed (Li0.8Fe0.2OH)FeSe.

(A) ARPES intensity along cut #1 shown in (C), as a function of Kc and deposition time (t). Red dashed line in the third panel (Kc ~ 0.12 ML) represents the band dispersion of α that derived from QPI (Fig. 5D). (B) ARPES intensity along cut #2 shown in (C), as a function of Kc and t. Dashed lines track the dispersion of the δ band. (C) Sketch of the Brillouin zone of (Li0.8Fe0.2OH)FeSe. (D) Evolution of the MDC along cut #1 upon K dosing, integrated over ±14 meV at EF (curves are shifted vertically for clarity). The intensity at Γ increases up to Kc ~ 0.12 ML. The decreased intensity at Kc ~ 0.27 ML could be due to approaching to the insulating phase (consistent with Fig. 4B). (E) Evolution of the EDC taken around k = 0 (Γ point) upon K dosing (Kc = 0 to 0.12 ML). The increased intensity between −0.04 and 0 eV is consistent with the emergence of an electron pocket. (F) Symmetrized EDC showing the evolution of the superconducting gap on the δ band, as a function of Kc. The momenta of individual spectra are indicated by the arrows in (B).
