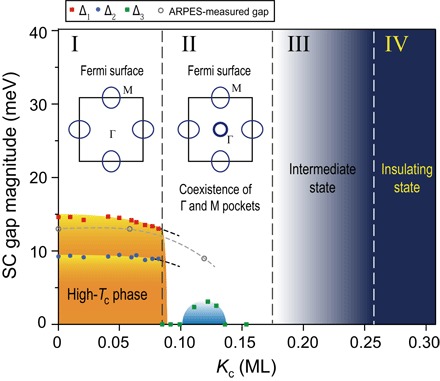
Fig. 7. Summarized phase diagram of surface K–dosed (Li0.8Fe0.2OH)FeSe.

The insets in regimes I and II sketch the Fermi surface before and after the Lifshitz transition. The red, blue, and green dots represent the value of Δ1, Δ2, and Δ3, respectively. Gray circles represent the ARPES measured gap size on the δ band (gray dashed line traces its variation). ARPES measurement suggests that Δ1 and Δ2 would not suddenly disappear when entering regime II, as illustrated by the short black dashed lines. SC, superconducting.
