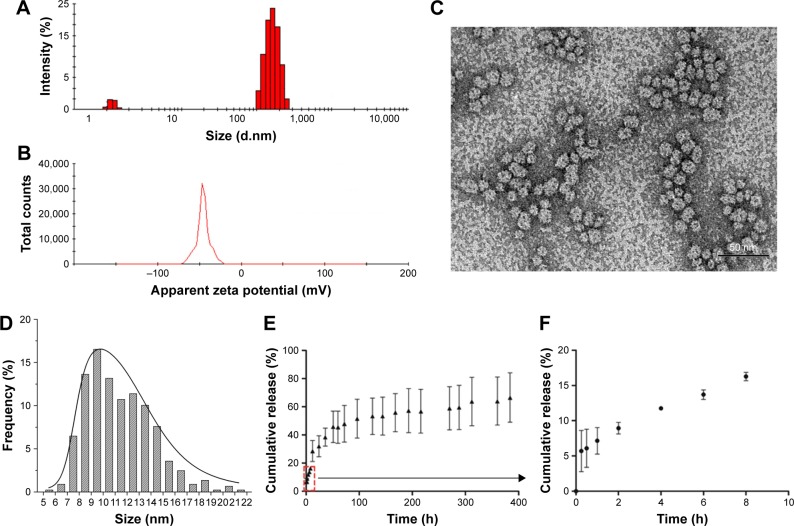
Figure 1.
Size distribution (A) and surface potential (B) were determined by dynamic light scattering. Transmission electron microscopy (C) and frequency histograms (D) of DOX-loaded GM1 micelles. Scale bar: 50 nm. Drug release profile of DOX from GM1 micelles at pH 7.4 and 37°C in PBS buffer (E and F).
Abbreviations: DOX, doxorubicin; PBS, phosphate-buffered saline.

