
Figure 1.
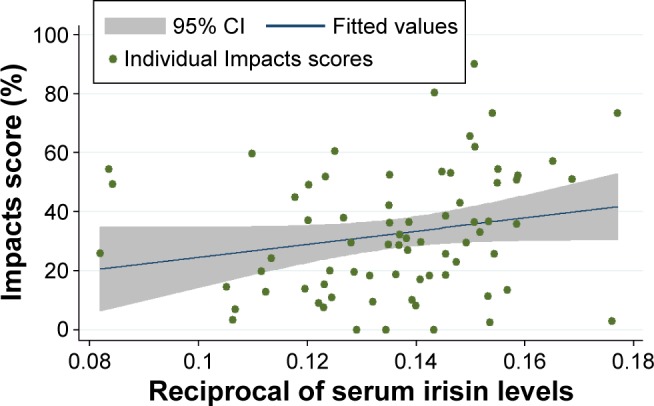
Correlation of mood disturbance (characterized by the Impacts score of SGRQ) and reciprocal of serum irisin concentration in the whole data set (n=74).
Notes: The x-axis shows the reciprocal of serum irisin level (in ng/mL), whereas the y-axis denotes the Impacts score of SGRQ. The blue line shows the fitted line to the data points (represented by the green dots), whereas the grey zone indicates the 95% CI.
Abbreviations: CI, confidence interval; SGRQ, St George’s Respiratory Questionnaire.