
Figure 2.
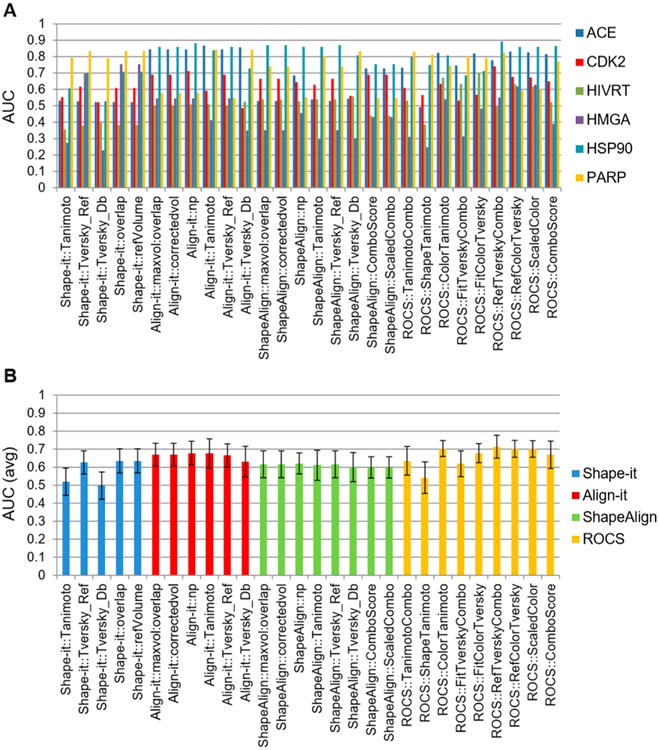
Performance assessment of 28 3D similarity metrics. (A) The performance of 28 3D similarity metrics were evaluated by the area under the curve (AUC) for six drug classes, where an AUC value of 1 indicated high selectivity and that of 0.5 indicated random selection. The results showed that ACE, CDK2, and PARP drug classes produced higher AUC values than HMGA, HSP90, and HIVRT. (B) Comparison of 28 3D chemical similarity metrics based on the average AUC values of six known drug classes. 3D chemical similarity metrics based on pharmacophore or a combination of shape and pharmacophore scoring produced higher enrichment factor (EF) values than those based on shape alone. Simple shape-based scoring produced the lowest EF values.