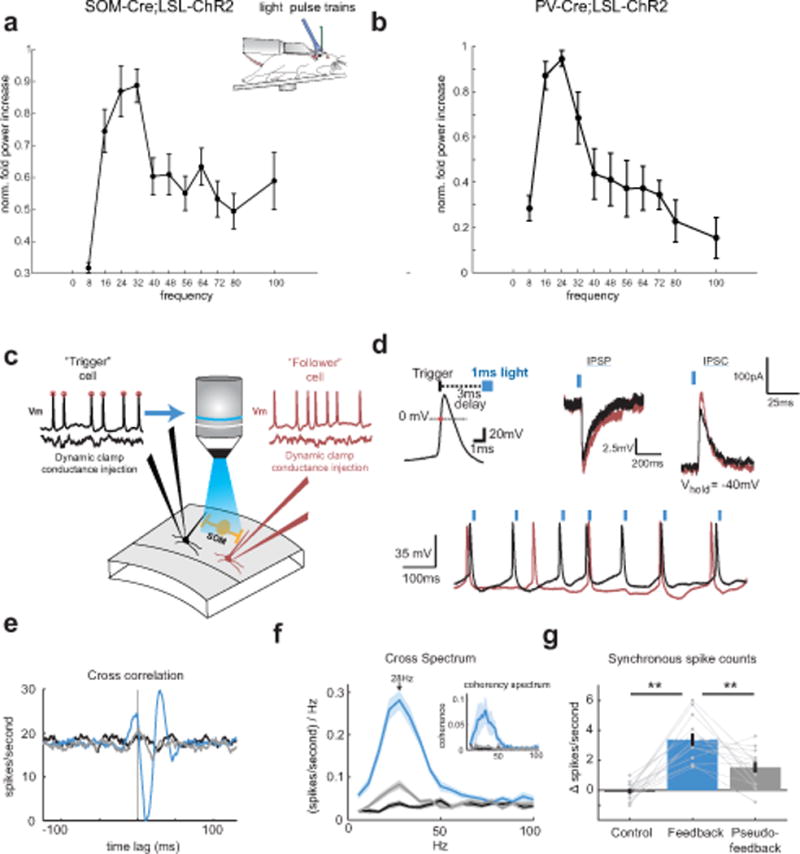
Figure 4. SOM neuron photo-stimulation can entrain gamma rhythmicity in vivo and in vitro. a).

Plot of the normalized fold increase in spectral power in different bands as a function of photo-stimulating SOM neurons at those frequencies (SOM: n = 7 cells; significant effect of stimulation frequency on fold-increase p < 0.001, Kruskal-Wallis ANOVA, error bars denote mean ± s.e.m.). b) As in a) but for PV neurons. n = 6 cells; significant effect of stimulation frequency on fold-increase p = 0.013, Kruskal-Wallis ANOVA c) Experimental schematic: Two L2/3 pyramidal neurons are patched in a slice from a mouse expressing ChR2 specifically in SOM neurons. The pyramidal neurons are injected with random and independent barrages of simulated excitatory conductances via a dynamic clamp. A custom fast feedback circuit detects rising 0 mV crossings of the membrane potential in the trigger cells, and drives blue light stimulation of nearby SOM-ChR2 neurons with a pulse of blue light. d) Top left: schematic of the spike-triggered optical feedback scheme. Top middle: Example membrane potential traces of the IPSP recorded in a pair of pyramidal cells to a flash of blue light (peak IPSP amplitude population mean = 8.0 ± 0.9mV). Current was injected to bring membrane potentials to −50mV. Top right: Voltage-clamp recording from the same Pyramidal neurons to the same light stimulus. −40mV holding potential (peak IPSC amplitude population mean = 210±40 pA). Bottom: example traces of action potentials in the recorded pair while optical feedback was engaged. Blue ticks indicated triggered flashes of blue light to the action potentials in the black trace. e) Example cross correlation between a recorded pair of pyramidal cells under control conditions (black), feedback (blue), and pseudo-feedback (grey). f) Average cross spectrum between the two recorded neurons’ spiking, (mean values between 22–39Hz: control= 0.033 (sp/s)/Hz, feedback= 0.242 (sp/s)/Hz, pseudo-feedback= 0.065 (sp/s)/Hz; p<0.001, Kruskal-Wallis ANOVA). Inset: Average coherence spectrum. g) Average change in synchronous spike probability for the recorded pairs of neurons under control, feedback, and pseudo-feedback conditions (mean values: control= −0.001, feedback= 0.034, pseudo-feedback= 0.015; n=13 pairs; p < 0.001, Kruskal-Wallis ANOVA). All error bars are s.e.m.
