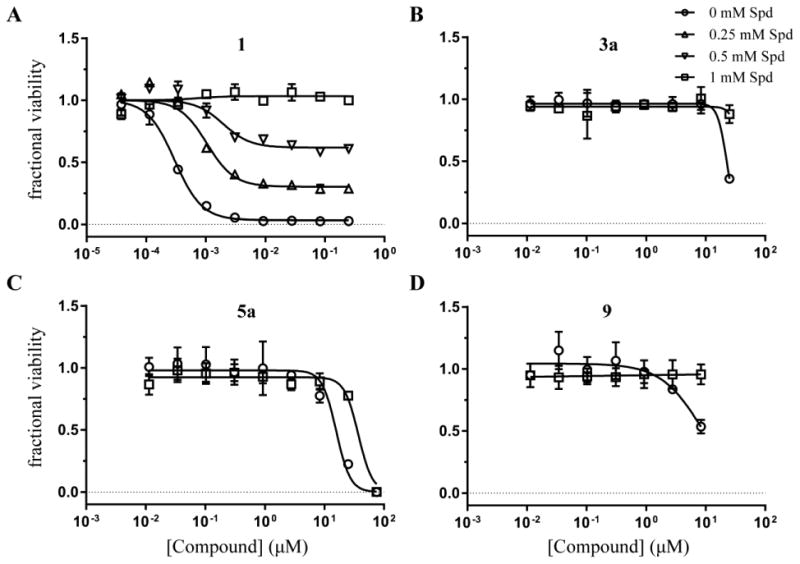
Figure 7. Rescue of compound-mediated parasite cell growth inhibition with a downstream metabolite.

(A) T. brucei cell viability concentration-response curves for compound 1 grown in the presence of 0 (circles), 0.25 (triangles), 0.5 (inverse triangles), and 1 mM (squares) spermidine (Spd). (B-D) T. brucei cell viability concentration-response curves for hit compounds 3a (B), 5a (C), and 9 (D) in the presence of 0 and 1 mM Spd. Data are shown as fractional viability based on CellTiter-Glo assay results after 48 h growth in the medium supplemented with chicken serum. Error bars represent standard deviation of the mean of three replicates.
