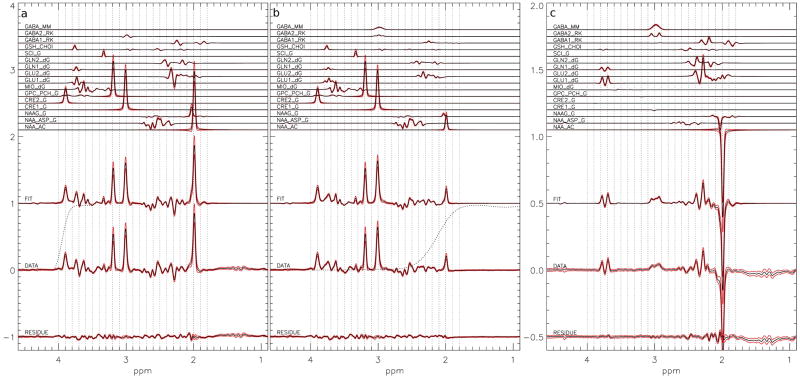
Figure 3.
The average of the 135 simultaneous fits to in vivo a) edit-off, b) edit-on, and c) difference spectra. Starting from the top: the simulated metabolite reference spectra, the sum of the fitted metabolite spectrum, the original data, and the residual of the fit. The simulated metabolite spectra are labeled with the metabolite abbreviation and the source of chemical shifts and coupling constants: RK, dG and G stand for R. Kreis (28), R. de Graaf (26), and V. Govindaraju (25) respectively. NAA_AC is the reference signal of the Acetyl moiety, NAA_ASP is the reference signal for the aspartate moiety. GLU1 and GLN1 are the reference signals for the 2C proton groups and GLU2 and GLN2 are the reference signals for the 3C and 4C proton groups of glutamate and glutamine respectively. GABA1 are the reference signals for the 2C and 3C proton groups and GABA2 the 4C proton group of GABA. The dotted line in a) shows the frequency response of lower frequency transition area of the water suppression pulse from 4.1 ppm to 3.5 ppm and in b) shows the higher frequency transition area of the GABA editing pulse. The red lines show the standard deviation over the 135 volunteers.

