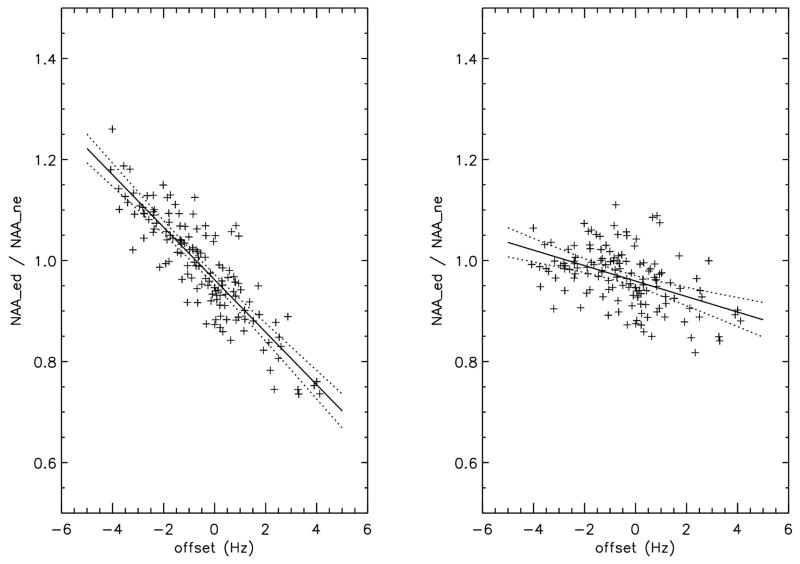
Figure 5.
The ratio of the edit-on NAA peak at 2.01 ppm (NAA_ed) to the edited-off NAA peak (NAA_ne) of the 135 subjects as a function of the frequency offset averaged over the entire scan. The left panel is the amplitude without frequency drift correction and right panel is with correction. The NAA peak is in the transition region of the editing pulse, making it sensitive to frequency drift during the scan. The solid lines are the best linear fit to the data and the dotted lines are the P=0.01 confidence range. The line fit statistics were listed in table 1.

