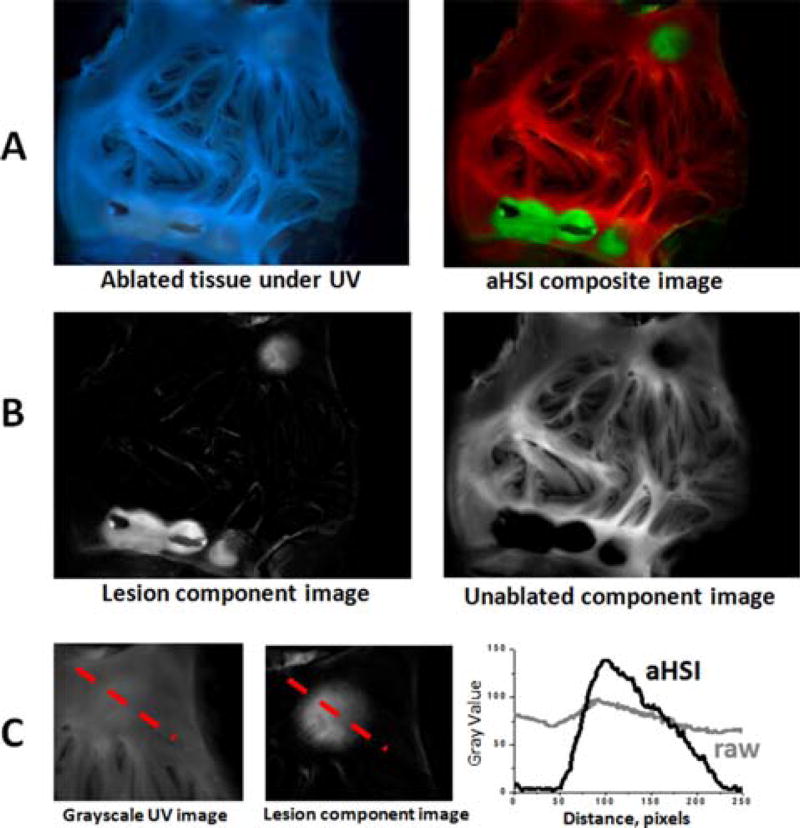
Figure 3.
Improved lesion visualization using aHSI. (A) Visual appearance of the ablated left atrial tissue under 365 nm illumination vs. the same tissue after a 420–720 nm aHSI datacube was acquired, processed and displayed as an aHSI composite image (green for ablated and red for unablated aHSI component images). (B) Corresponding component images. (C) Comparison of the intensity profiles across the RFA lesion from unprocessed grayscale UV image vs. aHSI lesion component image shows a significantly larger intensity change across the lesion.

