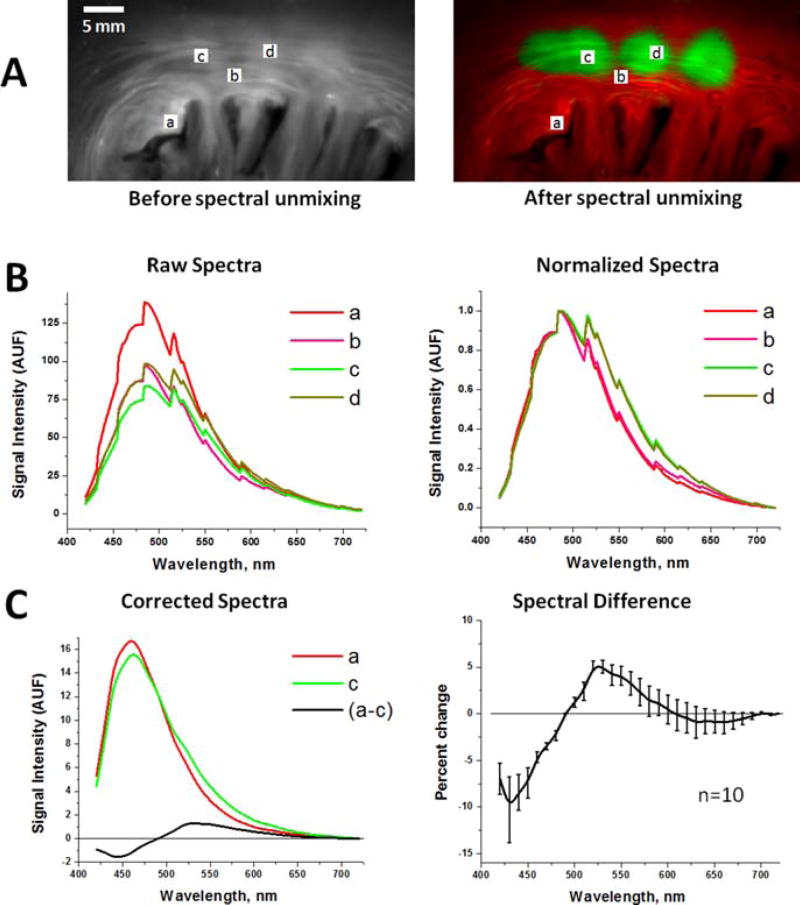
Figure 4.
Spectral changes used by aHSI for RFA lesion visualization. (A) Left: Endocardial surface of porcine left atrium under UV illumination. Right: An aHSI composite image of the same lesion. Four regions-of-interests (a–d) mark the areas from which the spectra shown were collected. Changing the location of the region of interest within each type of tissue had little effect on the outcomes of spectral unmixing. (B) Left: unprocessed raw spectra collected from the (a–d) regions-of-interests shown above. Right: the same spectra after normalization to their respective maximum and minimum values. (C) Left: Autofluorescence spectra from the region-of-interests (a) and the region-of-interests (c) after normalized spectra were adjusted for spectral sensitivity of the tunable filter and quantum efficiency of the CCD. Difference between the spectrum (a) and (c) is shown in black. Graph on the right shows spectral difference averaged from 10 lesions from three different animals.

