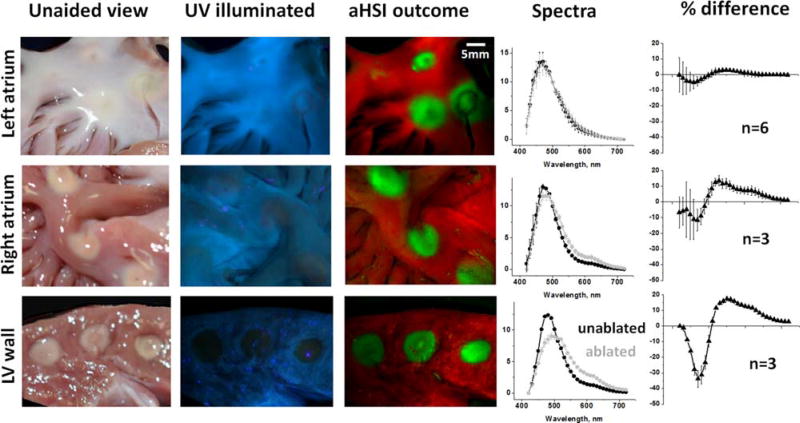
Figure 6.
Visual appearance of RFA lesions made in three different types of cardiac tissue, outcomes of aHSI unmixing and corresponding spectral changes. A typical appearance of endocardial surface of porcine left atrium under white light and UV illumination, followed by composite image derived ftom aHSI. On the right are spectra for unabalted and ablated tissue and the difference between them (expressed as % of peak autofluorence value, n indicates number of lesions). The next two rows show representative images and traces of RFA lesions made on the endocardial surface of right atrium and cross-sectioned left ventricular wall.

