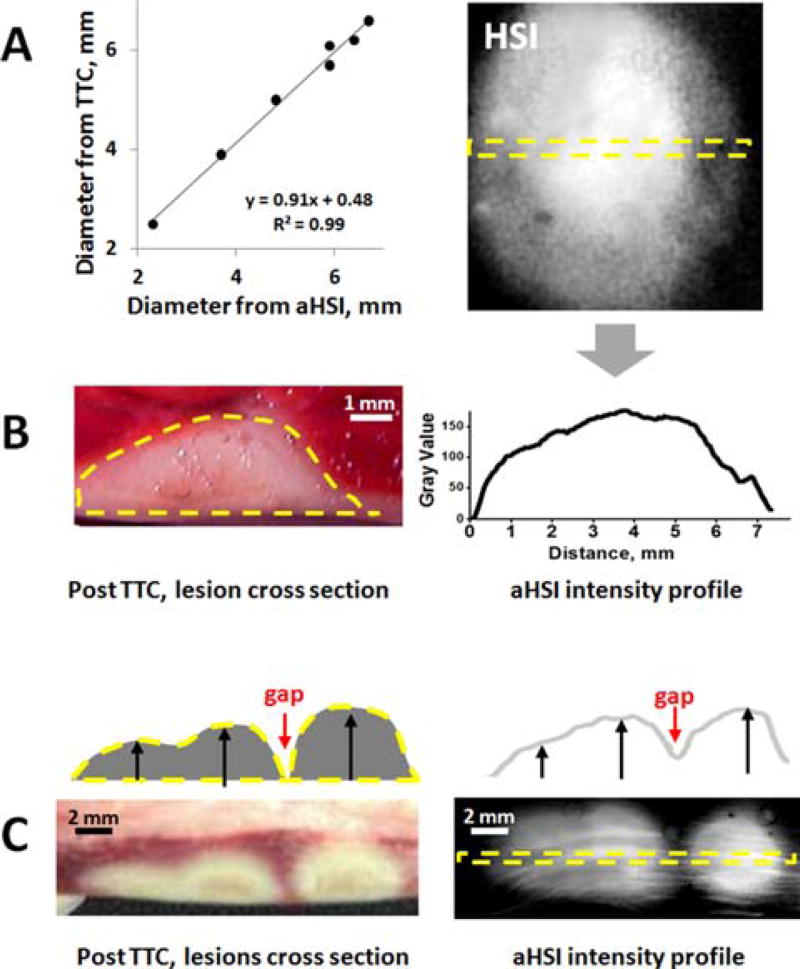
Figure 7.
Correlation of aHSI findings with gross pathology. (A) Graph shows a close correlation between lesion diameter values derived from gross pathology and aHSI profle (R = 0.99, p < 0.01, n = 7 lesions). (B) Cross-section of the lesions after TTC-staining revealed a close match between their depth and intensity profile of aHSI lesion component images. (C) An example of multiple lesions with gap in between: TTC staining vs intensity profile of corresponding aHSI lesion component.

