
Figure 5.
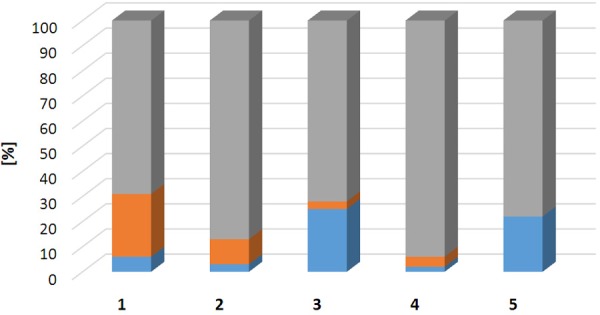
Bar graph presenting fractions of non-incorporated 68Ga(III) (blue), oxidized product (orange), and intact product (grey) dependent on the presence of radical scavengers (using 5 µM precursor): 1-without radical scavengers; 2-with EtOH; 3-with EtOH and ascorbic acid; 4-with EtOH and dihydroxybenzoic acid; 5-with EtOH, dihydroxybenzoic acid, and ascorbic acid. The data is presented as average of triplicate experiments.