Figure 1.

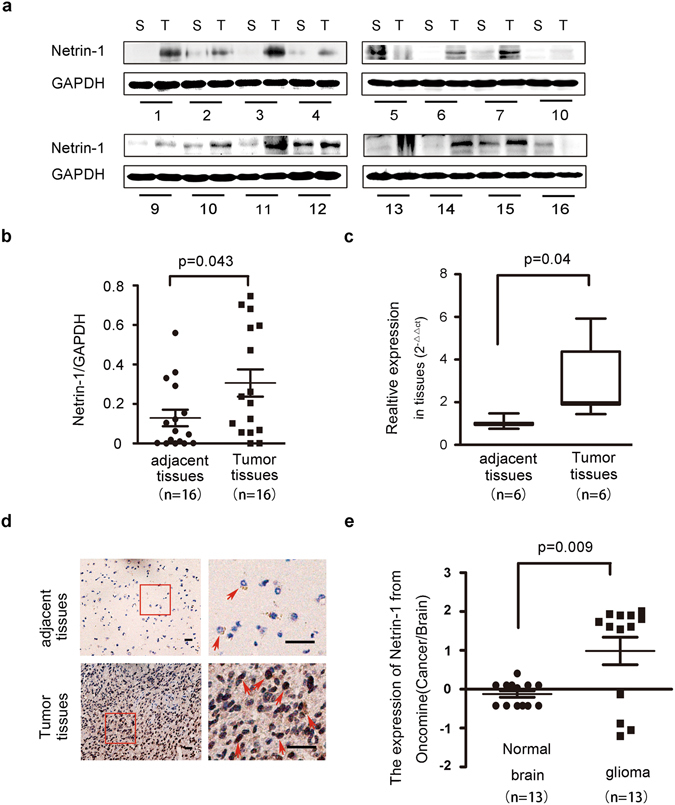
Netrin-1 expression was elevated in glioma tissue specimens. (a) Western blotting analyses of netrin-1 expression in fresh tumor tissues (T) and their adjacent normal tissues (S) from 16 patients (No. 1–16). Netrin-1 expression was significantly higher in glioma tumor tissues. GAPDH was used as a loading control. (b) Quantification of netrin-1 expression using Gel-Pro Analyzer 4 software. The values indicated the relative netrin-1 expression in the fresh samples. (c) Real-time PCR analysis of netrin-1 expression in 6 paired glioma tissues and adjacent normal brain tissues. The results represent data from three independent experiments. (d) IHC staining of human glioma cancer samples showing netrin-1 expression. Boxed areas in the left row are magnified and shown in the right row. Red arrowheads indicated examples of cells with positive netrin-1 staining. Scale bar: 50 μm. (e) Expression analysis of netrin-1 in normal brain and glioma samples from the Oncomine cDNA microarray database. The data are shown as the mean ± SEM.
