Figure 2.

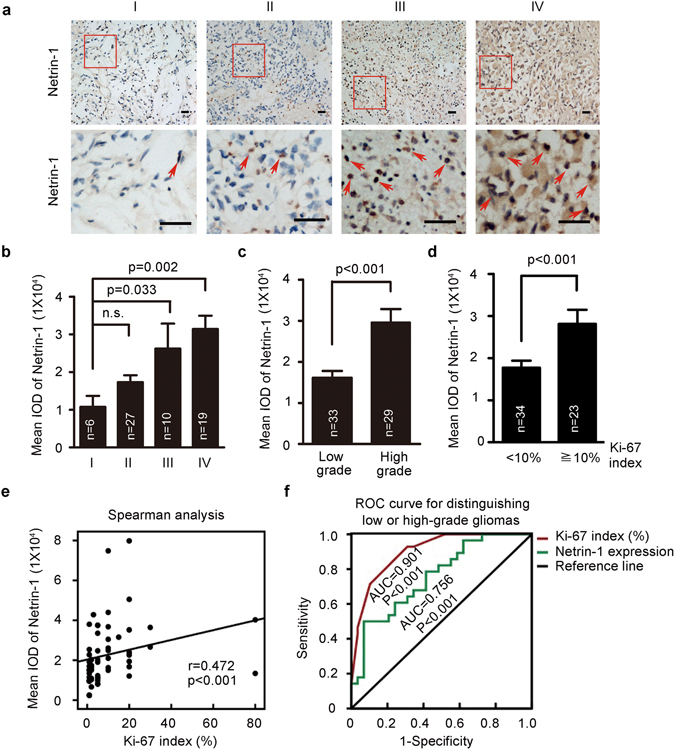
Elevated netrin-1 expression was positively correlated with cell proliferation in glioma tissue specimens. (a) Representative images of netrin-1 staining by IHC in glioma cancer sections. Boxed areas in the upper panels were magnified and are shown in the corresponding lower panels. Red arrowheads indicated examples of cells with positive netrin-1 staining. Scale bar: 50 μm. (b) Relative netrin-1 expression in glioma specimens of different grades. The mean integrated optical density (IOD) of netrin-1 staining was determined using Image-Pro Plus. (c) Relative netrin-1 expression in low- and high-grade gliomas. The mean IOD of netrin-1 staining was determined using Image-Pro Plus. (d) Ki-67 expression in low- and high-grade gliomas. (e) Netrin-1 expression and Ki-67 index of each glioma tumor sample were plotted for the Spearman analysis. (f) ROC analysis showed that netrin-1 expression (AUC = 0.756, p < 0.001) and Ki-67 levels (AUC = 0.901, p < 0.001) could discriminate low-grade gliomas from high-grade gliomas. One-way ANOVA and Student’s t-test were used to test for statistical significance. The data are shown as the mean ± SEM. n.s., P > 0.05.
