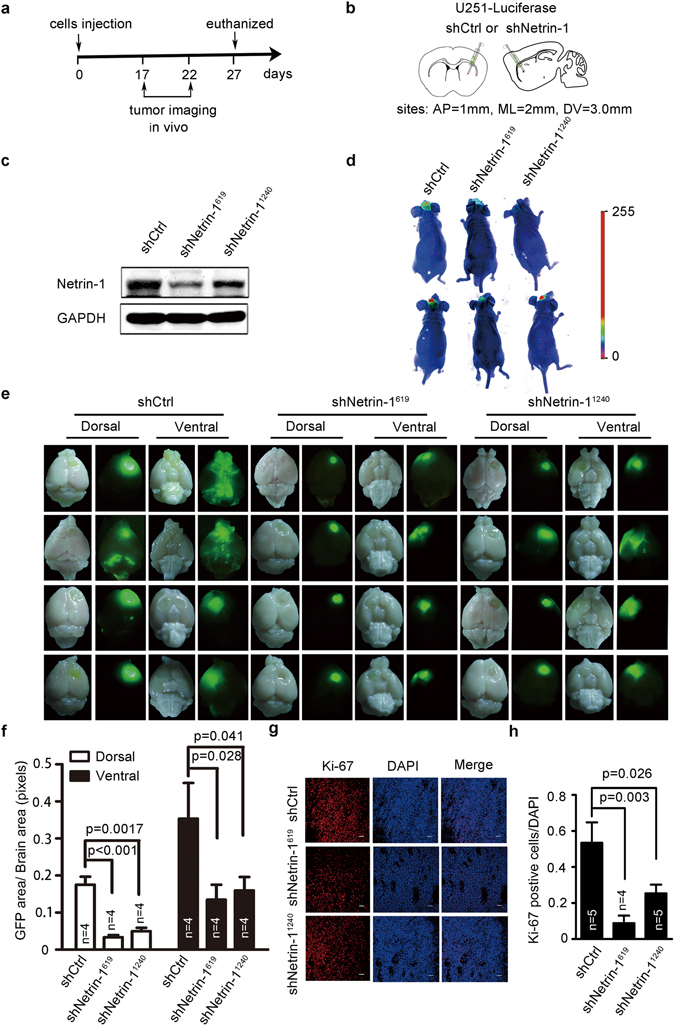
Figure 4.

Netrin-1 silencing inhibited glioma growth in vivo. (a) A schematic diagram of netrin-1 administration. (b) A schematic illustration of the injection sites. The red points indicate the injected sites. AP: anterior-posterior of the bregma; ML: medial-lateral of the bregma; DV: dorsal-ventral of the dura. (c) Western blotting analyses of netrin-1 expression in U251 cells stably expressing luciferase, Netrin-1 shRNA or control shRNA. (d) Images of luciferase signal in tumor-bearing mice visualized by administration of D-Luciferin (15 mg /mL, 200 µl/20 g) potassium salt via intraperitoneal injection. (e) Comparison of brain tumor growth in male BALB/c nude mice at the 27th day after implantation of U251 cells infected with lentivirus encoding luciferase together with Netrin-1 shRNA or control shRNA. Dorsal and ventral views of the brain tumors initiated by U251 in vivo (n = 4 for each group). (f) Quantification of the area of EGFP across the dorsal and ventral brain regions of mice after implantation using Image J software (n = 4 for each group). (g) Representative images of Ki-67 staining in U251-derived tumor sections. Scale bar: 50 µm. (h) Quantification of Ki-67-positive cells in the three groups (n = 4 for each group). Error bars represent the mean ± SEM.
