Figure 4.

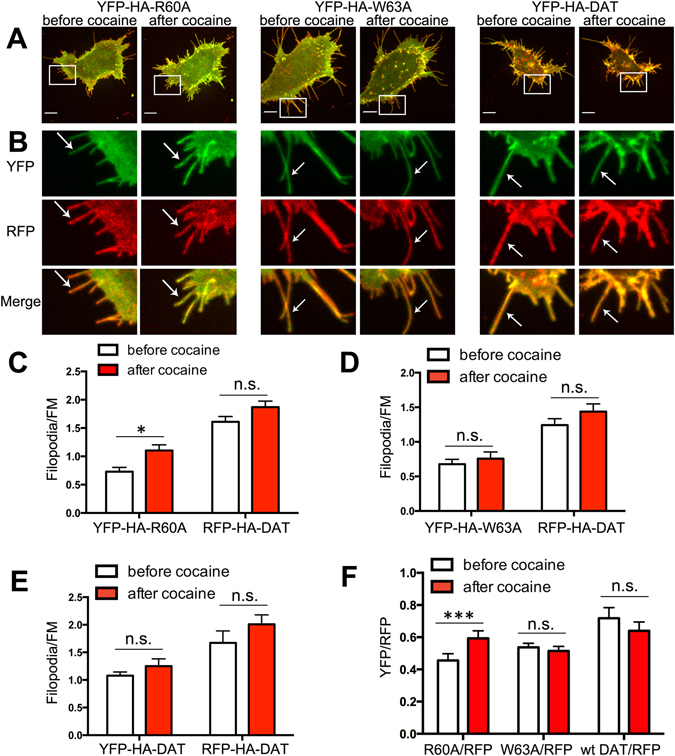
Binding of cocaine results in the enrichment of the R60A mutant relative to co-expressed wt DAT in the filopodia of HEK293 cells. (A) HEK293 cells co-expressing RFP-HA-DAT with YFP-HA-DAT, YFP-HA-DAT-R60A or YFP-HA-DAT-W63A were imaged through 515 nm (YFP, green) and 561 nm (RFP, red) filter channels before and after cocaine treatment (30 min at RT). Maximal z-projections of 5 consecutive x-y-confocal planes are shown. Scale bars, 10μm. (B) Insets represent high magnification images of the regions marked by the white rectangle in (A). Arrows point to examples of peripheral filopodia. (C–E) The Filopodia/FM ratios of YFP and RFP fluorescence intensities in cells co-expressing RFP-HA-DAT with YFP-HA-R60A (C), YFP-HA-W63A (D) or wt YFP-HA-DAT (E) were calculated in experiments exemplified in (A,B) as described in “Methods”. Results are shown as mean ± SEM, n = 10. (F) The YFP/RFP ratio in filopodia was calculated in experiments represented in (A,B). Results are shown as mean ± SEM, n = 10. *p < 0.05, ***p < 0.001. *p < 0.05, ***p < 0.001.
