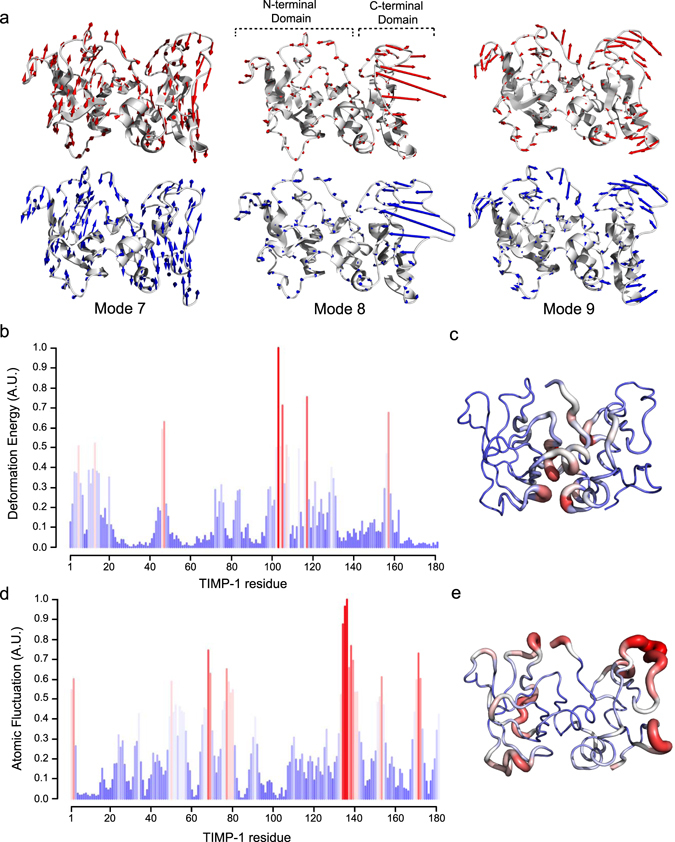
Figure 1.

Normal mode analysis of TIMP-1 structure. (a) Intrinsic dynamic of TIMP-1 along modes 7, 8 and 9. Open structures of TIMP-1 are in the upper part of the panel and closed structures are in the lower part. Arrows (blue and red) indicate the direction and the deviation (length of arrows) of each residue returning to the 3D reference structure of TIMP-1. (b) Deformation energy of each TIMP-1 residue (numbering of the mature secreted protein) along mode 7. The lowest deformation energies are coloured blue and the highest are red. (c) Visualisation of the TIMP-1 3D-structure of each amino acid deformation energy. Residues with the lowest deformation energy are thin and coloured blue and those with the highest atomic fluctuation are thick and coloured red. (d) Cα atomic fluctuation of each TIMP-1 residue (numbering of the mature secreted protein) along mode 7. The lowest atomic fluctuations are coloured blue and the highest are red. (e) Visualisation of the TIMP-1 3D-structure of each amino acid atomic fluctuation. Residues with the lowest atomic fluctuations are thin and coloured blue and those with the highest atomic fluctuations are thick and coloured red.
