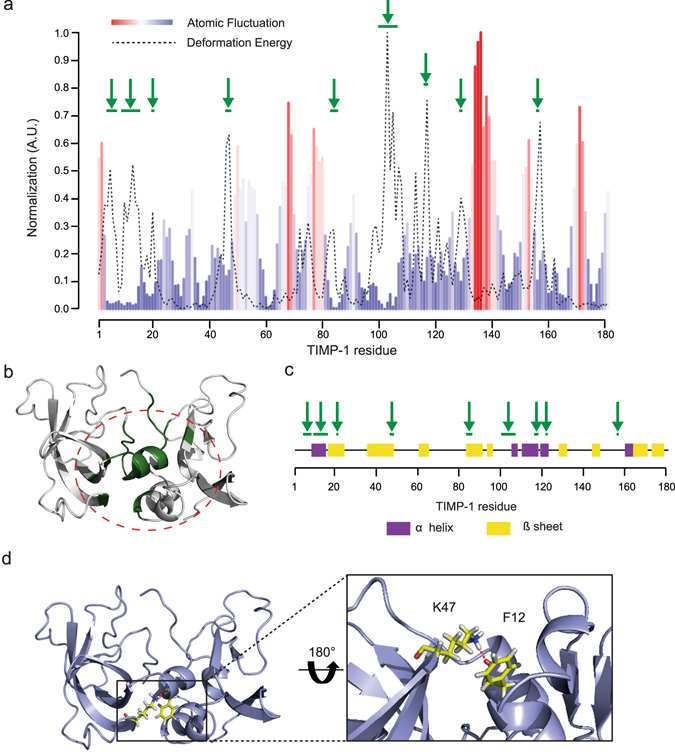
Figure 2.

Identification of residues involved in TIMP-1 interdomain movements. (a) Superposition of the deformation energy (dotted line) and atomic fluctuation (coloured bars) data from TIMP-1 residues (numbering of the mature secreted protein) along mode 7. The green arrows point out residues or sets of residues with both high deformation energy and low Cα atomic fluctuation. (b) Localisation in the TIMP-1 3D structure of the residues identified in (a) with both high deformation energy and low Cα atomic fluctuation. These residues are in an area surrounded by a dotted line. (c) Localisation in the TIMP-1 secondary structure of the residues identified in (a) with both high deformation energy and low Cα atomic fluctuation (green arrows). α helices are defined by the purple area and β sheets by the yellow area. (d) Left: localisation in the TIMP-1 3D structure of F12 and K47 residues. Right: hydrogen bond formed between the carbonyl oxygen of the F12 backbone and the K47 side chain.
