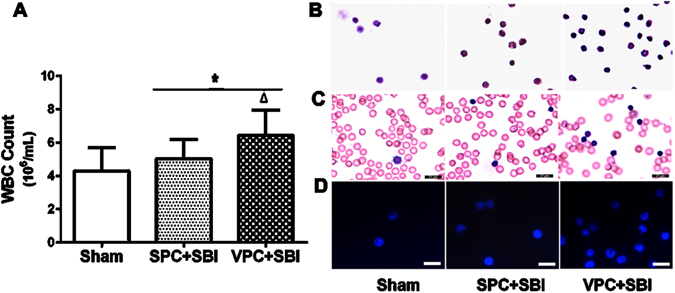
Figure 3.

Total peripheral WBC count and peripheral WBC suspension staining 24 h after SBI. (A) Total peripheral WBC count was increased in VPC + SBI group compared to Sham and SPC + SBI groups. *p < 0.05 vs Sham, ∆p < 0.05 vs SPC + SBI. Data are shown as mean ± SD. n = 8/group. (B) Hematoxylin and eosin (H&E) staining (n = 3/group) (C) Wrights staining (n = 3/group) and (D) DAPI staining (n = 3/group) of peripheral WBC suspension showing segmented granulocytes in VPC + SBI group. All scale bars = 25 μm.
