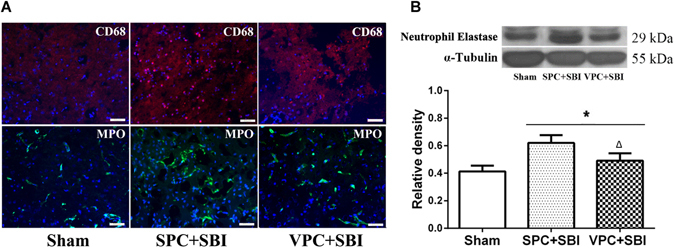
Figure 4.

Immunofluorescence staining and western blot showing inflammatory markers in the right frontal peri-resection site in Sham, SPC + SBI and VPC + SBI groups 24 h after SBI. (A) Immunofluorescence staining showed fewer CD68- and MPO-positive cells in VPC + SBI rats compared to SPC + SBI group. n = 2/group. Scale bar = 50 μm. (B) Western blot quantification showed that neutrophil elastase was reduced in VPC + SBI group compared to SPC + SBI group. *p < 0.05 vs Sham, ∆p < 0.05 vs SPC + SBI. Data are shown as mean ± SD. n = 6/group. The full length western blot pictures are shown in Supplemental Figure S3.
