
Figure 1.
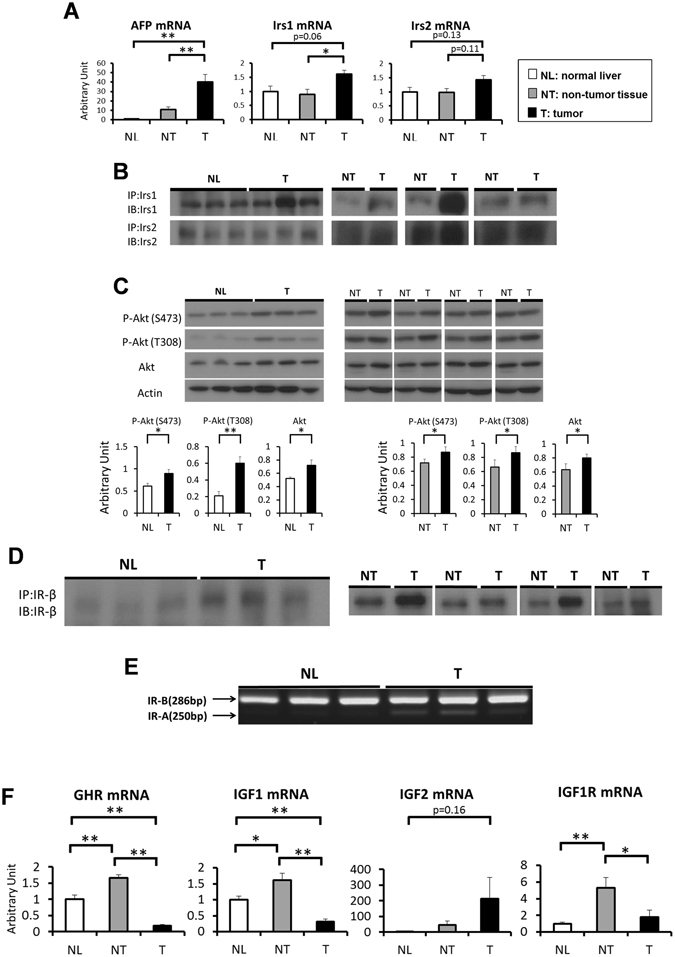
Irs1 is upregulated in DEN-induced HCC. (A) Expression levels of AFP, Irs1 and Irs2 genes in each group of mice (n = 7). (B) Western blot analysis of Irs1 and Irs2 protein expression levels in NL and T, or NT and T. Lysates from each group were immunoprecipitated (IP) and subsequently immunoblotted (IB) with the indicated antibodies. (C) Phosphorylation and protein expression levels of Akt. Representative immunoblot analysis for Akt and p-Akt (upper panel). Results were quantified and normalized to Actin (lower panel) in NL and T (n = 8), or NT and T (n = 8, paired t test). (D) Protein expression levels of Insulin receptor (IR). Lysates from each group were immunoprecipitated (IP) and subsequently immunoblotted (IB) with the antibody against IR-β. (E) The Insulin receptor (IR) isoforms A and B are indicated by an arrow. Total RNA was extracted from each group and cDNA was synthesized. After PCR experiments using primers for the flanking exons 10 and 12, reaction products were resolved on 2% agarose gels. (F) Expression levels of GHR, IGF1, IGF2 and IGF1R genes in each group (n = 7). Values are the means ± SEM of data obtained from each group. NL, normal liver tissues; NT, non-tumor tissues; T, tumors. *P < 0.05. **P < 0.01.