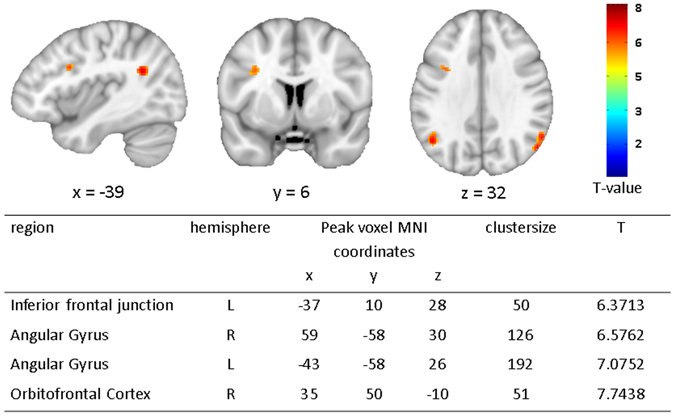
Figure 1.

fMRI results showing group differences (recAN > HC) during lose-shift behaviour (FWE; α = 0.01; k = 50voxels). In the upper panel brain maps are shown and in the lower panel local peaks of clusters are listed that are more activated during lose-shift in recAN. Abbreviations: lose-shift = negative feedback incurring a change in behaviour; L = left; R = right; HC = healthy control; recAN = recovered anorexia nervosa patient.
