
Figure 6.
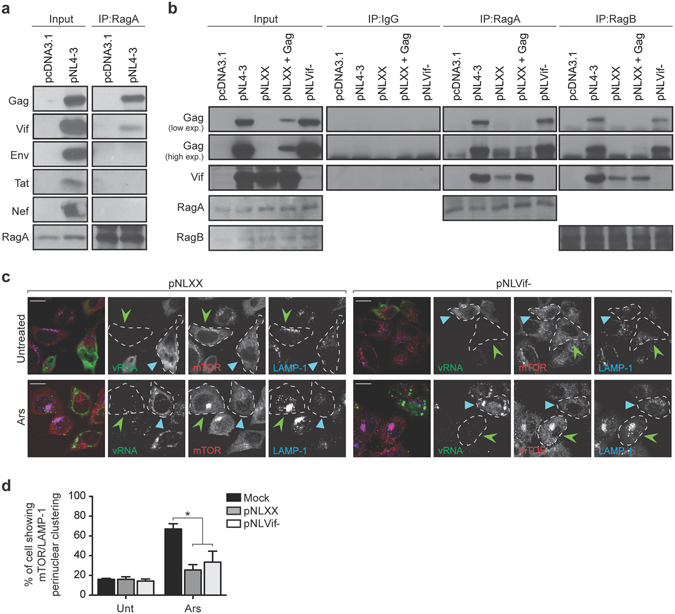
RagA and RagB interact with Gag and Vif. (a) Lysates from control pcDNA3.1- or pNL4-3-transfected HeLa cells were subjected to immunoprecipitation with RagA antibodies. Samples were subjected to SDS-PAGE followed by transfer to nitrocellulose membranes and probed with the indicated antibodies. Full-length blots are shown in Supplementary Fig. 5. (b) Lysate from pcDNA3.1-, pNL4-3-, pNLXX−, pNLXX+ pSVGag− and pNLVif–transfected HeLa cells were subjected to immunoprecipitation with RagA and RagB antibodies or isotype rabbit IgG control. The blots were probed with anti-p24, anti-Vif, anti-RagA and anti-RagB antibodies. Full-length blots are shown in Supplementary Fig. 5. (c) HeLa cells were transfected with either pNLXX or pNLVif- and left untreated (Unt) or stressed with 500 µM Ars for 1 h. HIV-1-expressing cells were identified using FISH to localize vRNA and stained using antibodies against mTOR (Cell Signaling) and LAMP-1. Light blue arrowheads identify pNLXX or pNLVif- expressing cells, while pNLXX or pNLVif- negative cells in the same field are indicated with green arrowheads. A dashed line contours individual cells. Scale bars are 10 μm. (d) The percentage of mock, pNLXX or pNLVif- transfected cells showing perinuclear clustering of mTOR/LAMP-1 from panel c. The results are presented as the mean ± S.D. from three different experiments. P value is indicated by *(p < 0.05).