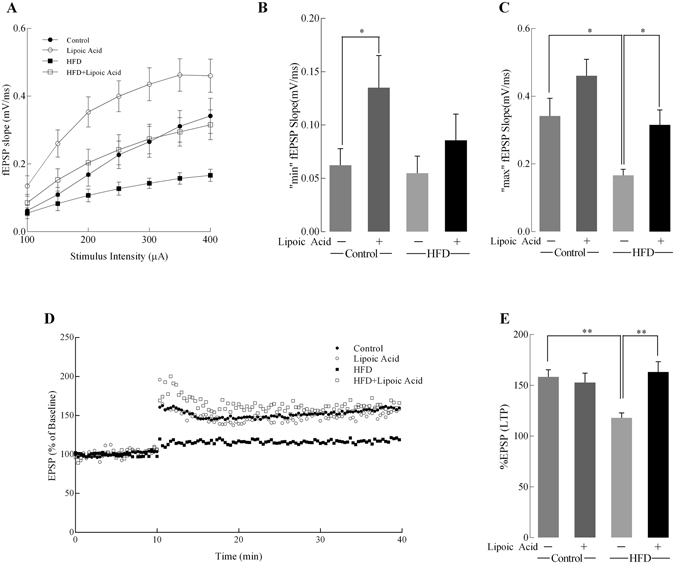
Figure 7.

Effects of lipoic acid on hippocampal synaptic plasticity. Input/Output (I/O) and changes after induction of LTP in all groups. (A) I/O relationship curves at increasing stimulus intensities; Bar graphs showing the minimum (B) and maximum (C) fEPSP slope values at 100 and 400 µA; (D) Baseline fEPSP slopes and those after induction of LTP; (E) The measured LTP using %EPSP for the last 5 min of the response to TBS stimulation. For each sub-figure: total n ≥ 8 slices/group and at least 3–4 animals/group. Data presented as mean ± SD, n ≥ 5, *p < 0.05, **p < 0.01.
