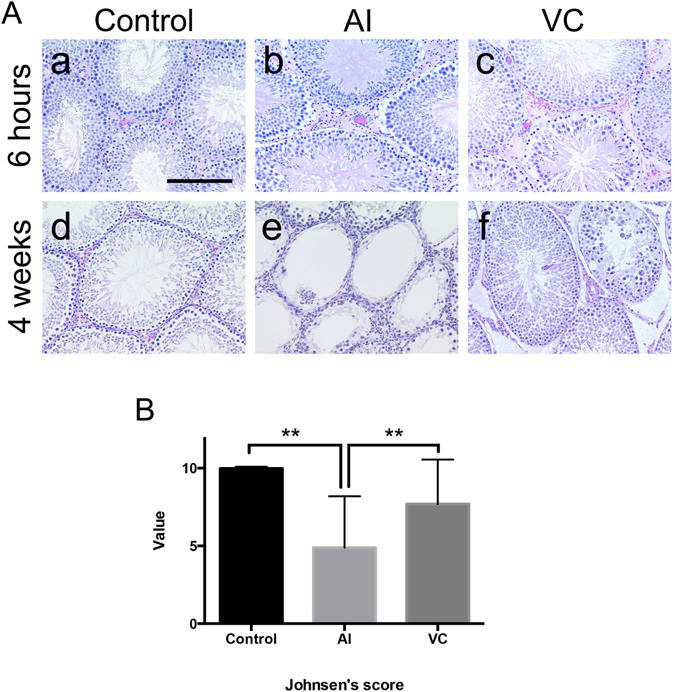
Figure 2.

Histopathological changes in rat testes with arterial ischaemia (AI) and venous congestion (VC) and after their reperfusion. A: (a) Control. (b) 6 h after AI. (c) 6 h after VC. (d) control after 4 weeks. (e) 4 weeks after reperfusion of AI. (f) 4 weeks after reperfusion of VC. Interstitium area in (c) showing the haemorrhage. Bar = 50 μm. B: Degrees of spermatogenesis at 4 weeks after reperfusion of AI or VC. Data are expressed as means ± standard deviation, and the two-way analyses of variance and Tukey–Kramer tests were used for statistical analyses. P > 0.05 was considered as indicating nonsignificant differences. **P < 0.01.
