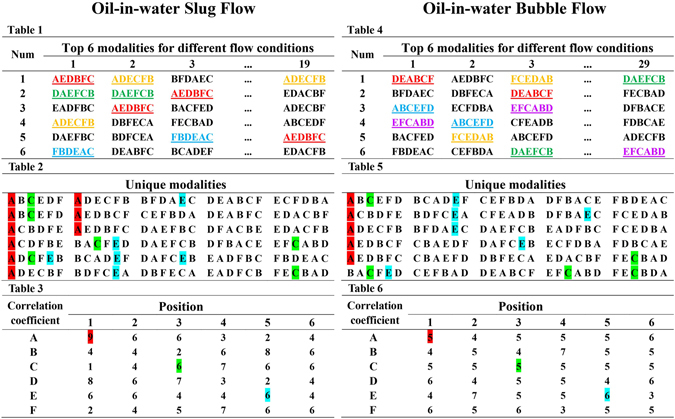
Figure 10.

The analysis of the critical modalities in oil-water slug flow and bubble flow. Table 1 presents the top 6 critical modalities in 19 oil-water slug flow conditions; Table 2 shows the unique modalities from Table 1 (i.e., all the modalities that appear in Table1 are listed only once in Table 2); and we break down the unique modalities in Table 2 and map the results into Table 3, where the element A1 in the A row and the 1st column shows the statistic of the correlation coefficient A in the 1st position in unique modalities. And similarly, Table 4, Table 5, and Table 6 are for 29 oil-water bubble flow conditions.
