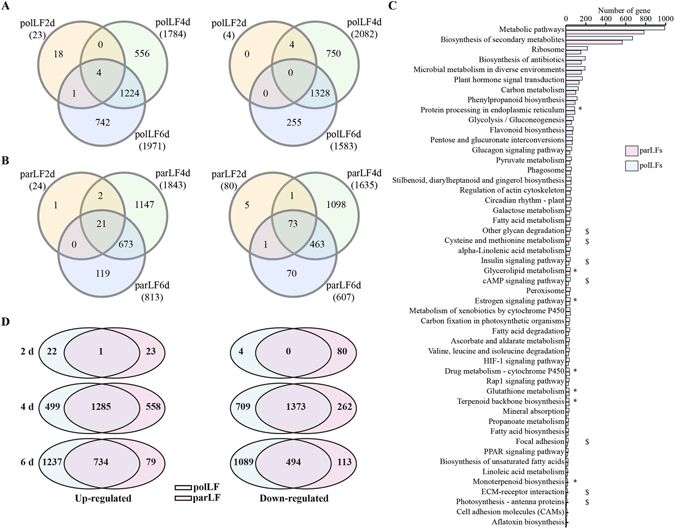
Figure 2.

DEGs identified in polLFs and parLFs. edgeR was used to identify the DEGs with strict criterial (log2FC >1 or log2FC <−1, FDR <0.05) in polLFs (A) and parLFs (B). KEGG pathway analysis (C) revealed most of the pathways were shared by DEGs in polLFs and parLFs. * and $ represent the pathways identified with significant enrichment by the DEGs only in polLFs and parLFs, respectively (D) Venn diragrams of DEGs identified in polLFs and parLFs at different developmental stages. Left panel: up-regulated genes; right panel: down-regulated genes.
