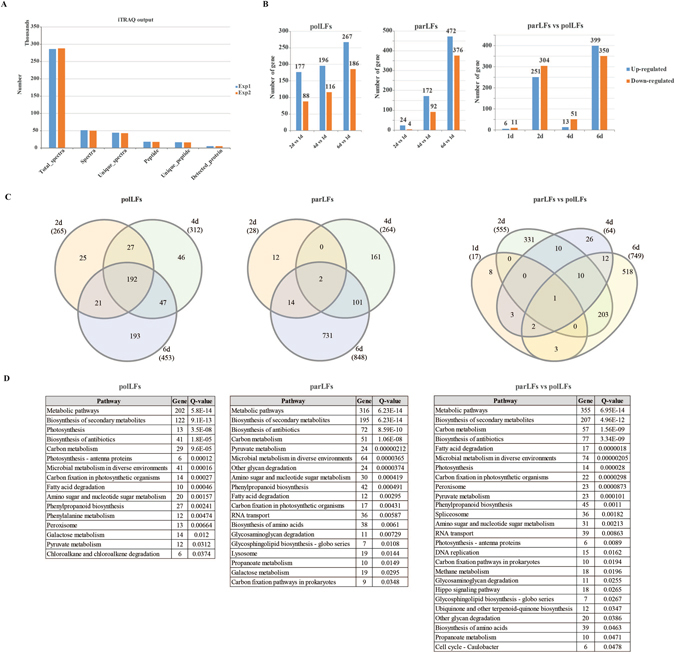
Figure 4.

iTRAQ proteomics analysis of polLFs and parLFs. (A) Overview features of of two individual iTRAQ experiments. (B) Differentially expressed proteins identified. Left: DEPs in polLFs (relative to polLF1d); middle: DEPs in parLFs (relative to parLF1d); right: DEPs in parLFs (relative to polLFs) at different stages. (C) Venn diagrams of DEPs. Left: DEPs in polLFs (relative to polLF1d); middle: DEPs in parLFs (relative to parLF1d); right: DEPs in parLFs (relative to polLFs) at different stages. (D) Significant (q < 0.05) KEGG pathways of DEPs identified in polLFs and parLFs.
